Volume IV, Issue 2
When we speak of visual information the reference may be to that which we look at and interpret, as well as the supporting information which gives context and clarity to that which we see. Below this are the definitions, the denotata, of such labels. This issue of PJIM contains articles that speak to pure visual outcomes, the collective language of data as displayed through maps, the taxonomy for a single descriptor within the language of visualization, and an argument for yielding control of a message toward a next-generation of branding and marketing. The four articles look to experimentation, collection, definition, and user considerations all advanced through the informative visualization process. We advance the craft of information design and information mapping by either applying capabilities to a problem or, on the academic front, by asking a question and pursuing answers. Answering a question is a theme for this collective: “What do I see when my eyes are closed?,” “What is an intelligent icon?,” “What happens when customers can directly modify a marketers informative touchpoint?,” and, “How can every citizen become aware and involved in what pollutants in the air, ‘look like?’” are queried, investigated, and reported upon for this issue. We thank the inquisitiveness of our contributors, and our readers, for this our fourteenth issue of PJIM.
Jihoon Kang, Publisher, and William Bevington, Editor-in-Chief
Parsons Journal for Information Mapping
What I See When My Eyes Are Closed
by Jeff Thompson, MFA
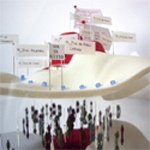
The Affective Mesh: Air Components 3D Visualizations As A Research and Communication Tool
by Nerea Calvillo, MsdAAd
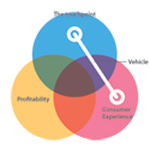
Capital Informatics: Permitting User Control and Interactivity Within a Consumer Touchpoint Without Sacrificing Profitability
by You Kyoung Kim, Bac +3
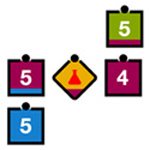
Icons and Intelligent Icons: How Compactness and Adaptability Advance the Utility of These Devices (Part One)
by William M. Bevington & David Fusilier, BFA