Volume IV, Issue 3
With this issue of PJIM we are greatly pleased to announce our new website. The format has been greatly improved with all articles readily accessible and consistently presented. We have also added functionality to the site, including a global search. A nod of thanks to SeungWon Hur for his yeoman’s efforts toward bringing our PJIM content into this graphically updated, and logically improved format.
As an advanced note to our readers we will be generating a theme-specific issue for our final articles of this year. Our next release (Volume IV, Issue 4) will focus on information security. In the fall of 2011 The New School hosted a Cyber Security conference that set a precedent for a broader based conference for this upcoming fall. Aligned to that effort PJIM will support articles for the next issue that focus on information security. Of particular interest is “ethical hacking” and papers dealing with methods to prevent hacking by testing a system to the potential breaking point.
For this season’s issue of PJIM our very loosely connected theme is content. We consider how content is supported through contextual research, allowing a very wide group of readers to see relationships of: cause and effect, time, topical understandings, or comparative ideas that traditional, written narratives may fail to convey. The transference of text into information graphics serves this role and is a major direction for journalism today. On a teaching-based note we have selected an article that describes how high school level students can take the content they have selected or been assigned and convey it not through mere written reports but as maps that teach them the value of correlations as well as the benefits of communicating through the effective language of maps. A language is only as good as its intended users know its fundamental usage and can apply the tool to the task. We look at an argument that suggests new forms to replace traditional Latin letterforms. The aspect of using symmetry, maintaining distinction, and using a logical relationships between thick and thin forms contributes to this potential symbol set that may be able to mitigate reading challenges for the dyslexic. Last we look at using real-time, user-generated content to produce whole content from pieces. In this article we will look at the nuts and bolts behind the real-time investigation of rapidly emerged city-wide protests and riots.
Jihoon Kang, Publisher, and William Bevington, Editor-in-Chief
Parsons Journal for Information Mapping
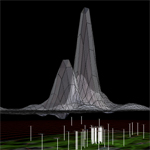
Real-time Urban Sensing and Information Visualization During City-wide Protests and Riots: Rome, October 15, 2011
by Salvatore Iaconesi, MEng & Oriana Persico, Msc
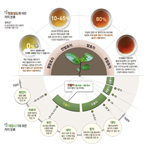
Paradigm Shift In How People Interact With Media
by Mi-sun Kim, BFA
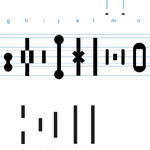
Dyslexic Notation: Combining Aesthetics and Scientific Notation To Combat Dyslexia
by Kanny Yeung & Gerald Morin
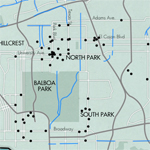
Complex City: A Student Atlas Of San Diego Cartography At High Tech High Media Arts
by Rachel Nichols & Margaret Noble Contributing authors: Natalia Molina & Meg Wesling