Volume V, Issue 3
The notion of journalism, particularly "high-journalism" evokes a great age of writers and photographers on the front lines of danger. The typewriter and the film camera catching light and action at the source of change and conflict. The word and image still serve; however, the sources are far more numerous and diffused and the tools of the professional do not vary greatly from the amateur or fortunate (or unfortunate) men, women, or children on the street. Journalism now involves assembly; and assembling data toward visual coherency is a primary task for information designers. Journalism today is as often, or as unsurprisingly, accompanied by pictures as by diagrams. This issue of PJIM brings three articles together that clearly underscore this trend that both supplements and supplants the photographic/typographic tradition.
Process, complexity, objectives, and user-considerations, amongst other factors, are discussed in the articles. Each author clearly has an individual take. Also, the degree of potential interactivity varies from zero to considerable. This addresses the user-factor of news media immersion and knowledge discovery. Welcome to new journalism, and some of its practitioners.
Jihoon Kang, Publisher, and William Bevington, Editor-in-Chief
Parsons Journal for Information Mapping
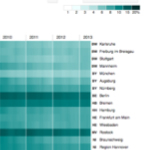
Data Driven Journalism at Zeit Online
by Paul Blickle
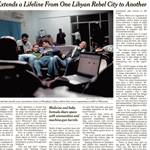
Visual storytelling at the Graphics department of The New York Times
by Sergio Pecanha
Visualizing Alien Life
by Michael Lawton, Jerry Beilinson, Kristie Bailey