Volume VII, Issue 4
Current practices for the processing and rendering of data are changing the very nature of story telling. Information Design tends toward contextual, rather than linear, display, breaking the tradition of the classical model in which a story has an orienting beginning that advances toward a climax and conclusion. This disjointed, yet coherent rendering, allows readers/viewers to ascertain their own “story” from the aesthetic representation presented. Of course linear stories have been modified into, or supported by, photographs, charts, diagrams, and other “non-linear” devices for eons. What has changed is the availability of massive data sets to work with, and the commensurate digital cross-platform tools that can be applied to the data.
Experiments that were once only performed by well-funded labs can be generated by dedicated individuals—an ever increasing number of “information makers” creates a self-enriching baseline that we may all draw from. The tools we have today allow for the rapid development of modeling and re-modeling data; discovering underlying patterns by which it is formed, or can be formed—and experimenting with cross-discipline (unfamiliar) renderings. The articles that compose this issue of PJIM touch on these three areas: development of the dissected story into a cohesive whole, rendering data —that is usually visually conveyed—into sonic form; and applying massive amounts of data to underlying patterns toward the goal of detecting actionable intelligence about environmental degradation.
Jihoon Kang, Publisher, and William Bevington, Editor-in-Chief
Parsons Journal for Information Mapping
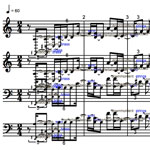
Transforming the Stock Markets into Music using DataScapR
by Samuel van Ransbeeck, PhD

CALL ME GAIA: The Geometry of Fragmentation or The Geometry of Life?
by Jean Gardner, MA & Jose de Jesus, MFA
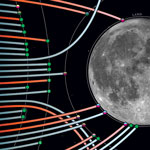
Mapping the Space Race: Form and Function for Non-Linear Storytelling
by Robert Capaldo