Volume VI, Issue 1
As the fields for applied visualization modeling continue to broaden, for both art-based and science-based endeavors, there is a subsequent requirement to more specifically define and support these endeavors. PJIM publishes articles that assist all practitioners in finding a common language from which to launch innovative visual solutions derived from hard data or from fluid concepts. This yields a wide cross-over of submissions to PJIM — in some respects, it is our goal to bring the computational and processing side to the arts, and conversely, to bring the abstract, experimental, and intuitive aspects to the sciences. For the initiation of our sixth year of PJIM we have chosen four articles that truly reflect this expanse of information/visualization potential: from the most esoteric and (we might say, philosophical) to the most pragmatic and applicable.
We look at ideas of Behavioral Art and how art can be applied as tool and not, per se, an aesthetic. From here we move to data-media-devices as potentially full adjuncts to human perception; this is demonstrated through a cross-over performance/experiment endeavor that has useful implications toward practical application. It is a kind of flying-by-instruments model for the intrepid pedestrian. Our third article considers computational, and highly specific visualization modeling; the authors look at visualization at the pixel relevancy level — Abstract Rendering that corresponds to the relevancy of each pixel is undertaken through supplied formula. Our fourth article is derived from DARPA sponsored research, it considers the value of improving highly integrated analysis of the parts and sequences of visualization — from data through users — and suggests how metrics of effectiveness can be increasingly objective when working with big data. It is both a powerful primer on big data exploitation, and a leverage toward quantifying usability metrics. All of our authors struggle with the pursuit of deriving knowledge from what things look like, or conversely, the desire to render something that informs us about the essence of what lies behind the aesthetic.
Jihoon Kang, Publisher, and William Bevington, Editor-in-Chief
Parsons Journal for Information Mapping
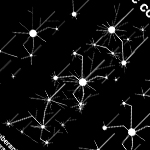
Mental Diagrams and Maps: Art’s Role in the Development of Cognition
by Judson Wright, MA

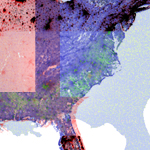
Digital Trust Hike
by Paul Taylor, MFA
Preserving Data While Rendering
by Joseph A. Cottam, PhD, Peter Wang
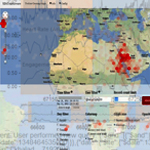
Measuring the Value of Big Data Exploitation Systems: Quantitative, Non-subjective Metrics with the User as a Key Component
by Jana Schwartz, PhD, Joshua C. Poore, PhD, Emily Vincent, MS, David Reed, MS