Volume VI, Issue 2
The field of visualization is replete with opportunities, and subsequent methods, for investigating artifacts. Opportunities exist because many archaic data sets, stored in static formats of spreadsheets (or even mere lists) can now be considered through new tools that reveal trends. Of particular interest is the crossroad of Geospatial Information Systems and historical data — or mere location based artifacts and their place in time. This issue of PJIM advances articles that look at artifacts, both physical and informative, with an aim at knowledge discovery. The range is from the rather minimilistic ephemera of cast-off Post-it notes (Pedrini); to serious scholarship in the Sociopolitical landscape of Ancient Greece. In the first case the objective is to consider the place of momentarily-critical hand-written documents from the perspective of their collective “color.” What trends may be discovered here? In the case of deep and developed scholarship a problem with insight often arises due to the sheer scale and complexity of the information; by affixing a shared “basemap” to this collection new intelligence is revealed. Sometimes such revelation is consistent in a series of resulting displays. One can see this in our article (Zhang) that exhibits a series of plumes that reveal a complex, yet fully traceable connectivity between connections and recommendations of the Royal Society — the renderings allow analysis through comparison. From a fully controllable, application based perspective a toolset such as POLIS (Krishnan, Ober, Pyzyk) allows the researcher to build unlimited models to expose potential trends or unforeseen patterns. The excitement of applying modeling methods to data we’ve had all along and seeing new things, or being able to work with a far more actionable process is the key theme of this quarter’s articles. As always, we thank our submitters, chosen authors, and mostly, readers, for the ability to continue this exploration through sharing our methods for doing so.
Jihoon Kang, Publisher, and William Bevington, Editor-in-Chief
Parsons Journal for Information Mapping
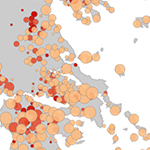
POLIS: Designing a Visualization Tool for the Research of Complex Sociopolitical Landscapes
by Maya Krishnan, Josiah Ober, PHD, Mark Pyzyk, MA
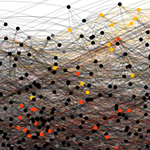
Comparative Trajectories in the Royal Society Network
by Jia Zhang, MFA
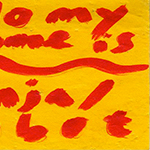
On Ephemerality: Perspectives on Communication Across the Analog-Digital Divide
by Noah Pedrini