Volume VII, Issue 3
Information can either be a welcome component into our daily “walkflow,” or something of a trespasser. When walking down into a subway station, or approaching any other large-scale transit system, a map and other forms of wayfinding are always welcome. The ads along the station walls may be also be a pleasant part of the journey, even as we recognize most ads are a form of information trespass. As the principal purpose of information design is to convey data that we (the targeted users) wish to take in, it’s mostly a welcome scenario. Even within this simple framework of the ostensibly welcome info-environment there are some sub-classes,examples of which are touched upon within the three articles that form the collection of this PJIM issue.
An idea for describing types of information delivery can be suggestedthrough the simple mnemonic of, “walls, halls, and stalls.” The walls are the backdrop, or the infrastructure of information that makes up the basic spaces that we physically and intellectually travel through. Our first article, dealing with cultural analytics address the idea of “walls.” When we interact with data we also interact with whatever branding supports the touchpoint. So, when we access an app through an icon we agree (by default) to give credence to the signifier. These icons have specific and cultural character meaning—cultural analytics allow us to understand the composition of our walls. At the next level we travel through halls—en route to some intended place. Now information graphics can be hung on the halls. The qualities of design and content integration are imperative steps of accessibility and effectiveness. The design is generally modular and highly logical.
Our second article discusses the making of such infographics, in this case for disaster preparedness—information welcome as potential uses walk down their walls of life. Stalls are our end-destination, specific places where we want to interact, engage, and spend time. Our last article deals with games that are both tactile (traditional board games) and digitally interactive. Each game has a unique personality, the nature of how it is played. There can be an abundance of variance and difficulty to the play; however, the user wants to be there. They will invest in the game-play requirements because this is where they have cognitively headed. By considering the images supplied with the three articles it’s interesting to see how the design and content refer to the walls, halls, and stalls of our daily walk with information.
Jihoon Kang, Publisher, and William Bevington, Editor-in-Chief
Parsons Journal for Information Mapping

Icons of Educational Apps as Media Artifacts: Understanding EdTech Apps via Cultural Analytics
by Evangelos Kapros, PhD & Kerri McCrory, PhD
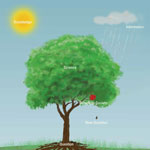
Living Science: Sowing Questions to Reap Solutions
by Saskia van Manen, PhD & Jihoon Kang, MFA
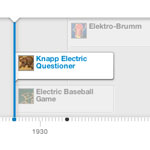
Meaningful Play: The Representation of Data in Hybrid Games
by Jason Corace, MFA