Volume VI, Issue 4
This is our concluding issue of year six for the Parsons Journal for Information Mapping. Six years has been a near-epoch. timewise, for the Information Design world—the buzzwords and keywords evolve and are eclipsed fairly rapidly: simplification, social networks, enhanced-cognition, knowledge acquisition, knowledge discovery, big data, anticipatory analysis. These are some of the key kinds of ideas, or “targets” that designers would be tasked with toward their objectives of “making intelligence visible.” in order to more rapidly convey and streamline the working process for constructing informative representations we expand the jargon within the field. In addition, there has been an explosion of “information design art” where the display of the data is in itself an aesthetic end-point from the process—thus lending a veneer of the expressiveness atop the informativeness.
Yet, against this, we’ve remained reasonably consistent respecting the four kinds of papers we aim to publish: 1) information design process and practice, 2) taxonomies and typologies that build a language around things within any field of study or interest, 3) information processing through new or unlikely methods (in order to see new things) 4) unusual data sets processed through existent technologies (in order to see how standard tools can reveal new insight). Oh yes, there is a fifth category: information design as a medium of the artist and experimental information design (about two articles per year).
For this issue we are particularly proud to publish a magnificent taxonomic and “building’block” system of both structure and elementary imagery that supports the understanding of procedures within stem-cell research. This system (for non-profit usage) has already supported educational and communication objectives due to its elegance of form and visual cross-consistency. On the front of practice and procedure comes a report of a recent hackathon supported by PIIM; the author provides a primer of the hackathon process through observation and feedback of the participants. Our third paper looks into GIS through the scoring of image gathering frequencies. What makes an area “interesting,” from strategic or objective (or subjective) reasons? As we close out this year, we again thank our contributors, and readers, for helping us tune our vision while riding the ever expanding information design field.
Jihoon Kang, Publisher, and William Bevington, Editor-in-Chief
Parsons Journal for Information Mapping
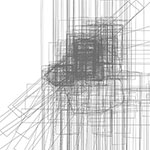
Points of Interest
by Richard Wheeler, MFA
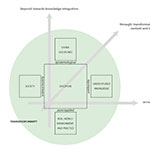
The Transdisciplinarity of InformationMapping in Practice: A Case Study of a Polar Data Hackathon
by Saskia van Manen, PhD
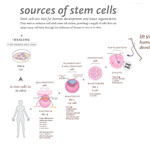
Modeling and Assembling Visual Devices to Compare Stem Cell Processes
by Julia Wargaski, BFA