Volume II, Issue 3

This issue addresses information visualization through a fairly wide scope—wayfinding, people, process, and theory. The first article provides a useful overview of the printed transit map. Of particular interest is the investigation of cartogrammic logic: the pro’s and con's of distorting geospace to support an easy-to-understand network. The second article shifts from the study of outcomes to an analysis of process, comparing the dimensions of “knowing” and “making” and the implications of “abstract” and “concrete” reasoning in the problem-solving model.

We then jump from formal transit and thinking networks to informal social networks, considering aspects of working spaces, working locations, and group collaboration. The final article in this sequence specifically deals with aspects of simplicity and complexity. It argues for the benefits of spatial, complex solutions when they are more beneficial than the mantra of simplicity would dictate. Together, these four articles provide an edifying range of knowledge from diverse corners of the art, information, and communication fields.

Brian Willison, Publisher, and William Bevington, Editor-in-Chief

Parsons Journal for Information Mapping

Aspects of Transit Map Design

by Peter Bain, MFA

Knowledge Visualization in Design Practice: Exploring the power of knowledge visualization in problem solving

by Joanne Mendel, MDes and Jan Yeager, MDes

Groups and Spaces - Mapping Collaborative Cultural Production and Social Art Practices

by Christopher Kennedy, MA

Complications and Adjacencies: An Organizing Logic for Information Graphics

by William A. Anderson & William M. Bevington

Aspects of Transit Map Design

by Peter Bain, MFA

KEYWORDS

Bus, cartography, graphic design, maps, metro, rail, subway, London Underground, transit, wayfinding

ABSTRACT

A printed transit system map is a specific representation of a transportation network, typically covering an entire urban area. In comparison to interactive guides offered by services such as Google, such a transit system map is subject to limitations of scale and range of information for users. Transit maps from London, New York, and Paris show evidence of consensus by designers and map publishers on what information is required and how to graphically convey it. Indications of streets and surface geography show some divergence and reveal conceptions of local identity and wayfinding. In addition to their functional role subway or metro system maps have attracted attention as design artifacts.

The design approach taken by Henry Beck and later adapted by Massimo Vignelli restricted the complex reality of transit lines to a limited number of angles. Advocates for network maps based on this technique claim greater understanding by users. Writers of books on transit have been gathering rules of thumb and formulating design guidelines. Separately, design guidelines for bus system maps have been produced. Both these guidelines and individual maps produced by transit map publishers are good candidates for further investigation concerning the user-centered design process. Given the growing use of interactive itineraries and other tools, the role of printed maps should be evaluated from the perspective of a diverse group of users. These users benefit from public information systems and should not be forced to adopt unnecessary technology

BIOGRAPHY

Peter Bain, a graphic designer and typographer, is Assistant Professor of Art at Mississippi State University. His MFA thesis at Virginia Commonwealth University was Design for Conspicuous Transit. He worked in New York from 1985 to 2007 and co-curated the exhibition Blackletter: Type and National Identity at The Cooper Union with Paul Shaw.

Knowledge Visualization in Design Practice: Exploring the power of knowledge visualization in problem solving

by Joanne Mendel, MDes and Jan Yeager, MDes

KEYWORDS

Design practice, insight generation, knowledge visualization, problem solving, sense making, visual modeling

ABSTRACT

This paper presents knowledge visualization as a design activity in problem solving. In contemporary design practice the increasing complexity of problems and the range of information with which design practitioners engage is driving the need for more robust processes and tools. This increased problem complexity and information range must be addressed in order to design relevant, meaningful solutions for people.

We situate visualization within a four-phased model where the intent is to understand the dimensions of a problem. Visualization aids in sense-making and cognitive processing of complex information. It accomplishes this through framing ambiguous states, bringing order to complexity, making sense out of seemingly unrelated things, and finding insights that are buried in data.

Within the problem-solving context the four-phase model’s value goes beyond the functional level of simply representing information. Additionally, it operates as a powerful instrument for thinking in analysis, synthesis, and insight generation. Visual models and frameworks serve as tools to illuminate relationships and meanings within data and define the areas to explore and construct solutions.

BIOGRAPHY

Joanne Mendel, MDes is a design strategist with diverse experience that spans innovation and strategy consultancies, global corporations and start ups. She’s evolved humancentered product, service and brand experiences across a broad range of industry sectors. Joanne’s passion is for the most information-intensive aspects of design practice where she’s developed methods for revealing insights and framing solutions. She comes from a background of design research, information architecture, semiotics and graphic design.

Joanne earned a Master of Design from I IT’s Institute of Design and holds a BFA in Graphic Design from California College of the Arts and a BA in General Studies from the University of Kentucky with concentration in visual semantics.

Jan Yeager, MDes is a design researcher with diverse experience in visual communications and information design. Currently her work focuses on exploring methods for enabling shared understanding of complex problems through visual models and storytelling.

Jan holds a B.A. in Anthropology from the University of Arizona, a BFA in Communications Design from Pratt Institute, Brooklyn, New York, and a Masters of Design in Human Centered Communications from the Institute of Design, Illinois Institute of Technology.

Groups and Spaces - Mapping Collaborative Cultural Production and Social Art Practices

by Christopher Kennedy, MA

KEYWORDS

Collaborative art, collaborative platforms, community-based Art, dialogic, relational aesthetics, sociograms

ABSTRACT

In every place, wherever there are people, groups form and spaces are used. Most often these spaces are for living or for working, but every once in a while groups form and spaces are utilized to experiment and create.

Groups and Spaces is an online platform that gathers together information on people making art in collaborative situations and independently-run artist spaces. The site serves as a dynamic forum for critical discourse on collaborative cultural production and artist-run culture. The project explores ways to visualize and represent relationships and the associative impacts of collaborative groups and spaces through sociogramming applications, geolocation technologies, and a mobile library unit.

The article will discuss the variables and systems involved in collecting and disseminating information through these new applications. The article will also discuss how the visual mapping of collaborative art practices can be framed as a dynamic learning resource and as an asset for schools, institutions, and art communities.

BIOGRAPHY

Christopher Lee Kennedy is the Director of the Institute for Applied Aesthetics, a research-based thinking tank for art and learning. http://www.applied-asthetics.org

Complications and Adjacencies: An Organizing Logic for Information Graphics

by William A. Anderson & William M. Bevington

KEYWORDS

Adjacencies, basemap, Coelacanth, Coelacanthiforme, information design, information graphics, stacking, superfice, visualization, VT-CAD

ABSTRACT

The composing of intelligible patterns from the noise of raw data is a hallmark of a good information designer. The most successful examples extract and present essential relationships in a coherent manner while limiting the obtrusiveness of accessory relationships. Effective results are self-evident whereby the information graphic is absorbed by the mind holistically. Such clarity often belies the intense efforts involved: like a baton race, all the work is concentrated to a point just before being passed on to the next participant in the informational relay. To this end, the designer applies a pattern or grid to position all the interrelational data fields. We call this process stacking: the mechanism for creating a beneficial complication whereby users see and understand holistically, which we consider to be cognitively superior to linear presentations.

The success of layered compositions depend on the appropriateness of the basemap (pictorial, relational, quantitative, or symbolic) and the quality of the designer’s integration. What can be correlated should be correlated. What cannot be interrelationally correlated, such as titles, labels, metadata, etc., should not interfere with the stacking grid since they introduce noise. Any “noisy” element is better brought “outside” the main grid and handled as an adjacency. Stacking interrelateable information fields through effective grid patterns, and supporting such a composition through non-interrelateable adjacencies, yields effective results in information graphics.

BIOGRAPHY

William M. Bevington currently serves as Associate Professor of Information Mapping in the School of Art, Media, and Technology at Parsons The New School for Design, The New School, New York. He formerly served as the Executive Director for Parsons Institute of Information Mapping, Chairman of the Communication Design department at Parsons School of Design, and various professorial and instructional roles at his Alma Mater, The Cooper Union for the Advancement of Science and Art. He is an information designer and information theorist specializing in creating tools for the rapid assessment of complex data. His first significant project was the Blackout Procedures Manual for Con Edison in 1983, and the last was a major Geospatial Media Mash-up Tool under U.S. government contract entitled the Geospace and Media Tool (GMT). Mr. Bevington has developed toolsets for transit systems applications, stock trading applications, and health management tools as a principle designer at Spire Integrated Design, New York. He has lectured worldwide, illustrated Graphic Designers Production Handbook, co-authored Working with Graphic Designers and Designing with Type with Jim Craig. He is also the author of Typography: The Principles, A Basic Guide to Using Type published by The Cooper Union.

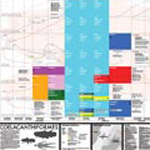
William A. Anderson is an undergraduate student at Parsons The New School for Design pursuing his BFA in Communication Design. His focus is on information and interactive design, and he possesses a deep interest in design methodology. The Coelacanthiforme project featured in this paper was developed as part of an assignment in an information design class taught by Mr. Bevington. In addition to the project images, he contributed the associated captions and schematic plans, as well as the sections entitled “The Designer’s Learning Curve” and “Notes on Typographic Refinement.” In his spare time he teaches Children’s World Kanreikai Karate at the Society for Martial Arts Instruction.