Volume III, Issue 1
We open our third volume of PJIM articles under the rubric of mapping writ large. Every article deals, in some manner, with knowledge extraction and the power and informativeness of visual context. The first article invokes a mapping exercise that exploits publicly-published content (Twitter, Flickr) that reveals social networks, activity, and trends via the paradigm of topography. This is followed by how gameplay is analyzed through the mapping of player data utilizing meta-interfaces: interfaces that analyze usability respecting multiple categories of play. Our third article considers the mapping of consumer feedback through “qualitative synthesis”; again, getting the big-picture through visually organizing methods. We conclude with content-aspects of scale and media with an in-depth review of how large surfaces, paper or otherwise, provide informational context that small screen devices cannot emulate; the treatise should be required reading for every interface designer.
Brian Willison, Publisher, and William Bevington, Editor-in-Chief
Parsons Journal for Information Mapping
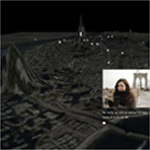
Invisible Cities: Representing Social Networks in an Urban Context
by Christian Marc Schmidt, MFA & Liangjie Xia, MPS
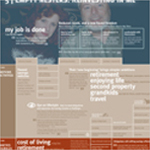
Consumer Insight Maps: The Map as a Story Platform in the Design Process
by Kim Erwin, MDes
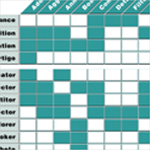
Analytics of Play: Using Information Visualization and Gameplay Practices for Visualizing Video Game Data
by Ben Medler, PhD Student & Brian Magerko, PhD

Thinking Big: Large Media, Creativity, and Collaboration
by Alex Soojung-Kim Pang, PhD